|
This version of the viewer has extended capabilities in comparison to the previous version (2.xx). The program is a very fast browser of TEOAE files acquired with any of the ILO family of equipment (88, 92, 96 , 292 etc). It is very easy to use and provides the essential information presented in the main panel of the ILO software such as : The name and last name of the subject, the stimulation modality ( linear, nonlinear, QuickScreen), ear etc.
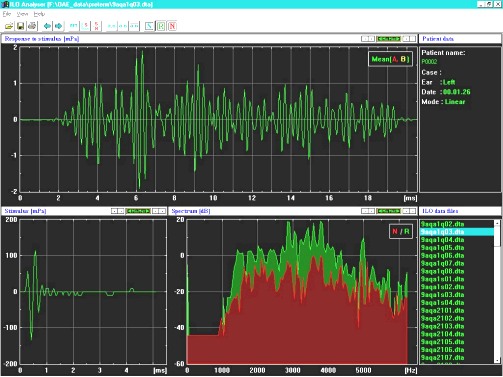 Figure 1 Figure 1: TEOAE response from a 32 weeks (PCA) preterm neonate.
|
 |
How to Use the program
|
 |
|
The program contains information divided in the following 5 panels :
- The FORM of the TEOAE response (with visible both traces A, B or their corresponding mean M).
- The data of the tested subject (ear, protocol, date etc).
- The form of the stimulus.
- The spectra of the TEOAE response (green) and of the noise (in red).
- The directory with the ILO data( i.e. files with the dta extension).From this panel you can localize the files which interest you and using the arrows (under the HELP menu)you can "navigate" backwards and forwards within the ILO recordings, each time visualizingthe ILO information.
|
|
New Features of version 3.xx
|
|
|
Version 3 provides the possibility to calculate a cross-spectrum from the available ILO data extending the frequency range of the viewing window up to 12kHz. There is also a new command panel with 14 icons(shown below) with the following functions :

From the left to the right
- Icon 1: Open an ILO file (TEOAE or SOAE but not DPOAEs).
- Icon 2: Export the ILO file data in a txt format. The exported data included the responses from buffers A and B, the stimulus spectrum and the FFT spectrum.
- Icon 3: This icon prints the data presented in the 5 panels.
- Icon 4: Previous file in the ILO data directory. This opion is activated when a subdirectory and a list of files have been selected. This option is not working with data structures on a CD-ROM drive.
- Icon 5: Next file in the ILO data directory
- Icon 6: The button determines the origin of the plotted spectra. As a default the program uses the data stored in the ILO data file. The user can select another option (FFT analysis) where the program estimates the spectrum of the TEOAE response from the available raw data, but in a recording window of 12 kHz. From the two options (spectrum of th mean, cross-spectrum) the second is more appropriate in order to evaluate the high frequency content of the TEOAEs.
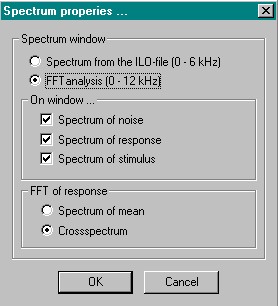 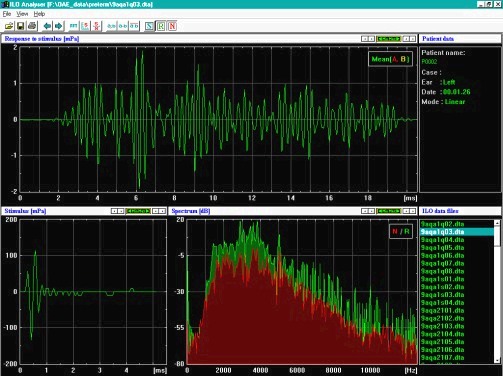 Figure 2 Figure 2: Data as in Figure 1, but showing an expanded frequency spectrum
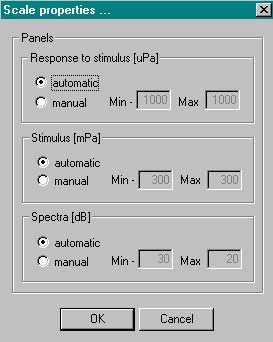
- Icon 7: Button to set the scale-range of the data, the stimulus, and the spectrum plots. It is possible to use an automatic scale (the program scales according to the max value of the data set) or to set a predefined max value. The latter feature is useful in order to compare the properties of TEOAE responses from different subjects.
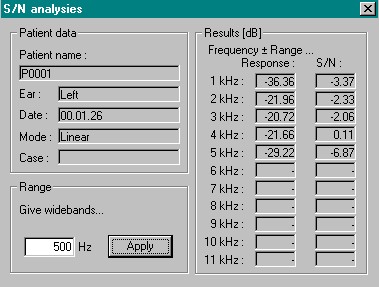
- Icon 8:This icon opens a dialog box showing the response and S/N values of the selected TEOAE recording. If the internal FFT analysis has been selected previously, the panel will show data values up to 11 kHz.The user has the possibility to increase the width of the frequency displayed bands. For example using the default band-width of 500 Hz the S/N ratio at 1.0 kHz covers the fequencies from 0.5 to 1.5 kHz.
- Icon 9: This icon selects to display in the response panel, both data traces (the buffers A and B in the ILO terminology).
- Icon 10: This icon selects to display in the response panel, the difference between the buffers A and B, which is considering as an estimate of the noise embedded in the ILO recording.
- Icon 11: This icon selects to display in the response panel,one trace which is the average of buffers A and B.
- Icon 12: This icon selects to display in the spectrum panel, the stimulus spectral data.
- Icon 13: This icon selects to display in the spectrum panel, the TEOAE response spectral data (color green).
- Icon 14:This icon selects to display in the spectrum panel, the noise spectral data (color red).
Two additional controls are available in the four data panels.They can be used to expand (ZOOM) or condense the plotted information. The controls look as in the image below:
|
|
HOW to Download the program (FREE DOWNLOADING)
|
|
|
The program is in "exe" format and cannot be downloaded the traditional way. Please use the contact-us page to provide information on the ILO-viewer version you are interested and your email address. You will receive the program via the Wetrasfer.com services.
|